Even though I’m the engineer in the family, my wife is more of a gadget freak than me. This year, she beceame interested in tracking her workouts. She started out with a FitBit, and found that to be rather useless, so we returned that. Lately, she’s been into training for a half marathon, so we started using GPS workout tracking apps on an iPhone 5 and iPhone 4S.
We played with several different apps: Kaiser EB Walk, Nike+, MapMyRun, NeoTreks, and Runkeeper. It’s interesting how you can run several apps simultaneously on an iPhone, and get wildly varying metrics from them. The distance and pace vary quite a bit between apps, and I think the main reason is that the realtime geodata coming out of the iPhone is crap. Therefore, the app developers implement different filtering strategies on the data, leading to the different calculated metrics.
I find it amazing that the iPhone has an onboard GPS, accelerometer, and compass, and still manages to output such bad location data. Granted, the GPS antenna is quite small, but GPS watches are pretty small these days, and work much better. My guess is that Apple needs to do some work in iOS’ sensor data processing code. If only they would give us access to raw GPS data, rather than forcing us to use their garbage location API’s…
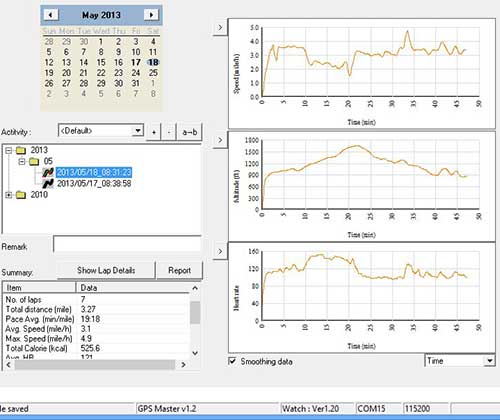
Following the recommendations of friends, my wife recently bought a Garmin Forerunner 10 (FR10) GPS watch. I was skeptical that it was worth the $130, price tag, and was very interested in finding out how much better it would perform than the iPhone. After using it for only a few days, I must say that I am very impressed. Unlike my 10 year old Garmin eTrex GPS, the FR10 gets a fix very quickly, and manages to keep the fix even under moderate tree cover and in canyons.
Below, I will compare the simultaneously recorded outputs of RunKeeper, MapMyRun, and the FR10. I chose RunKeeper and MapMyRun as the iPhone apps, because they offer easy access to the logged track data in the form of GPX files, and both websites allow you to upload/edit track data. Note that the MapMyRun and RunKeeper data were recorded simultaneously on my iPhone, so they share the same sensor data.
Route plotted on Google Maps:
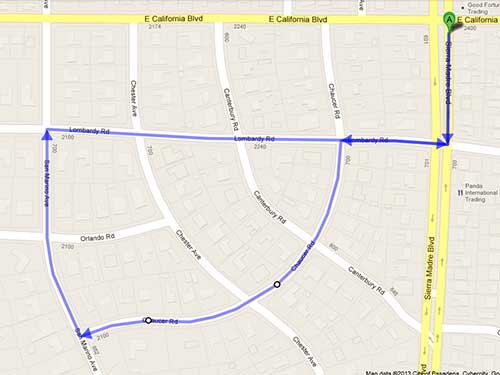
Calculated distance: 1.3mi
RunKeeper
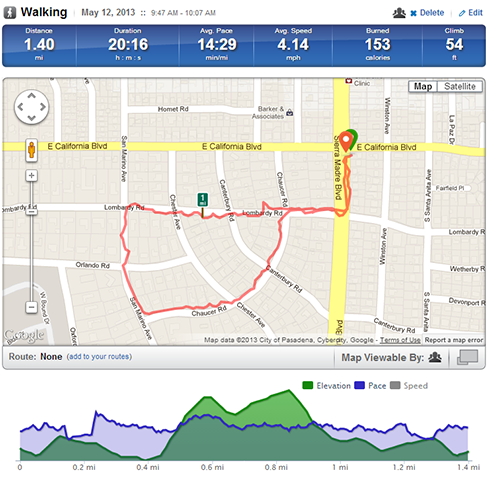
Despite the fact that the route is largely in a flat area, with very little tree cover, notice how the track wiggles and meanders.
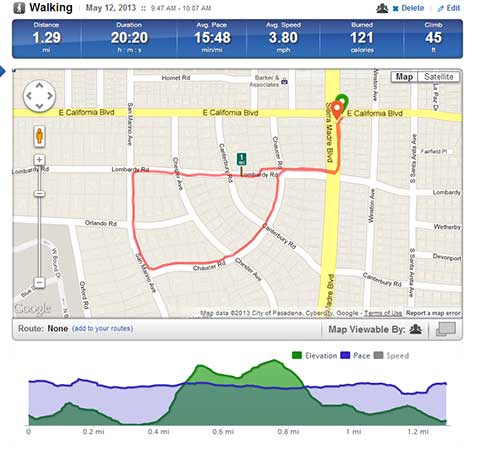
MapMyRun
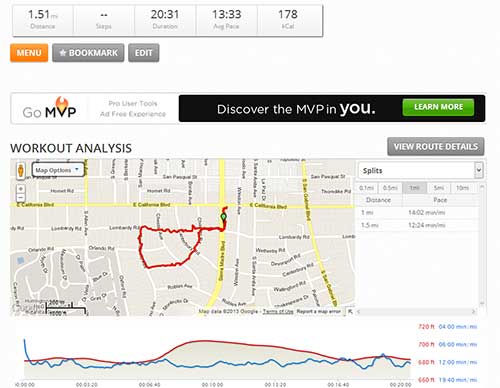
The MapMyRun track, as expected, also wiggles quite a bit.
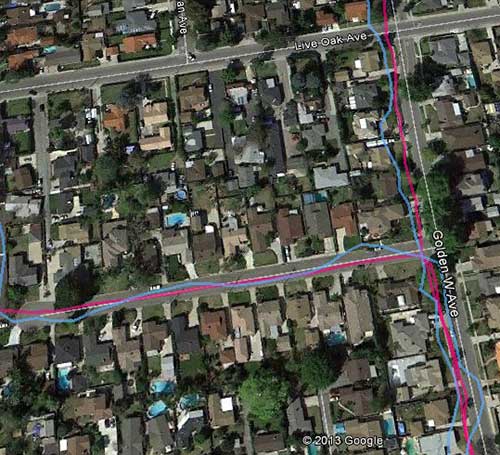
MapMyRun Track on RunKeeper.com
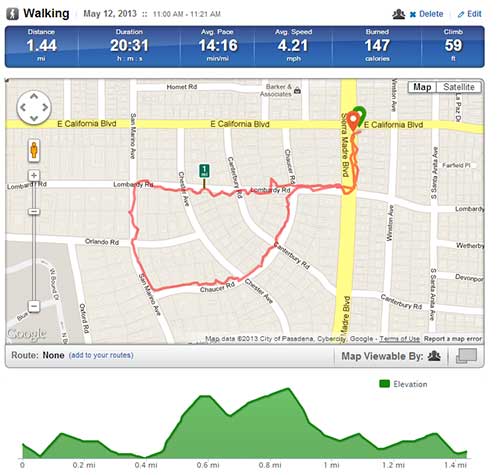
The above plot is taken from a GPX file exported from MapMyRun.com of the workout, as recorded by MapMyRun. Notice how RunKeeper.com, using the same track data, calculates the distance/pace/calories differently. I have found that MapMyRun consistently calculates the longest distances, and highest calorie count of the bunch.
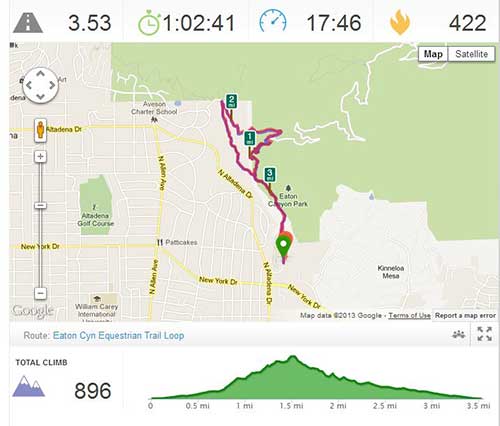
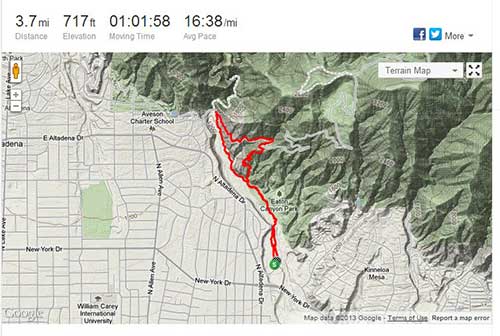
Garmin FR10 on Garmin Connect
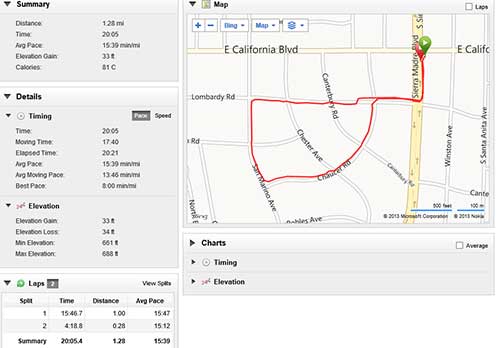
Note how the Garmin track is very clean and smooth, and tracks the roads reasonably closely.
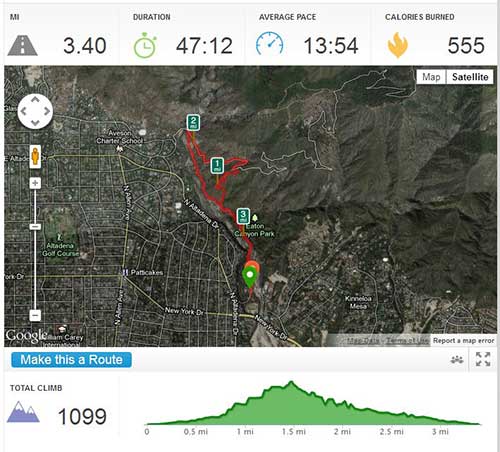
Garmin FR10 Track on RunKeeper.com
The above plot is of GPX data exported from Garmin Connect, and then uploaded to RunKeeper.com. The FR10 stores the track data in a proprietary FIT format, but luckily, their website is able to output GPX. Again, notice that RunKeeper.com used the same data, and yet, calculated different results.
Comparison
|
Distance (mi) |
Calories |
| RunKeeper |
1.40 |
153 |
| MapMyRun |
1.51 |
178 |
| FR10 (Garmin Connect) |
1.28 |
81 |
| MapMyRun Track on RunKeeper.com |
1.44 |
147 |
| Garmin FR10 Track on RunKeeper.com |
1.29 |
121 |
| Google Maps |
1.3 |
N/A |
Below are some data from a couple of other routes that I tested:
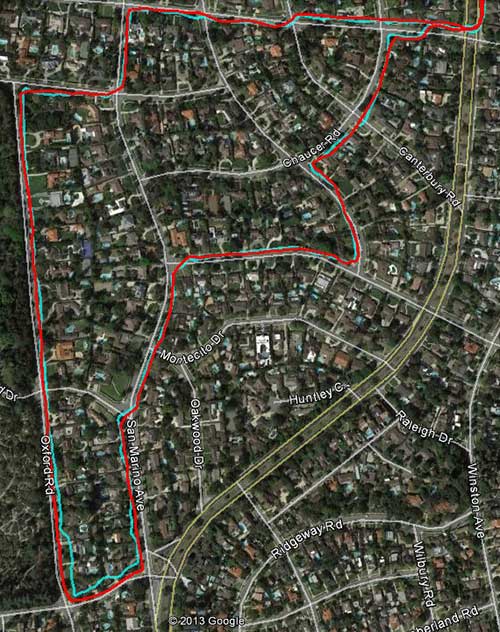
Euston Loop
|
Distance (mi) |
Calories |
| RunKeeper |
2.53 |
279 |
| MapMyRun |
2.71 |
306 |
| FR10 (Garmin Connect) |
2.44 |
156 |
| MapMyRun Track on RunKeeper.com |
1.44 |
147 |
| Google Maps |
1.3 |
N/A |
| Manual Plot on RunKeeper.com |
2.55 |
N/A |
Winston Loop
|
Distance (mi) |
Calories |
| RunKeeper |
1.79 |
186 |
| MapMyRun |
1.83 |
205 |
| FR10 (Garmin Connect) |
1.66 |
103 |
| Manual Plot on RunKeeper.com |
1.73 |
N/A |
Discussion
While my sample size is small, some trends emerge. The Garmin FR10 consistently calculates the shortest distances and calories. MapMyRun consistently calculates the longest distances and highest calorie counts. There is a difference between the calculation methodology between RunKeeper.com and MapMyRun.com, because given the same GPS track, MapMyRun calculates a longer distance (1.51 vs 1.44mi) and a higher calorie burn (147 vs 178cal) than RunKeeper.com. On the other hand, Garmin Connect calculates shorter distances and calorie burns than RunKeeper.com, given the same track.
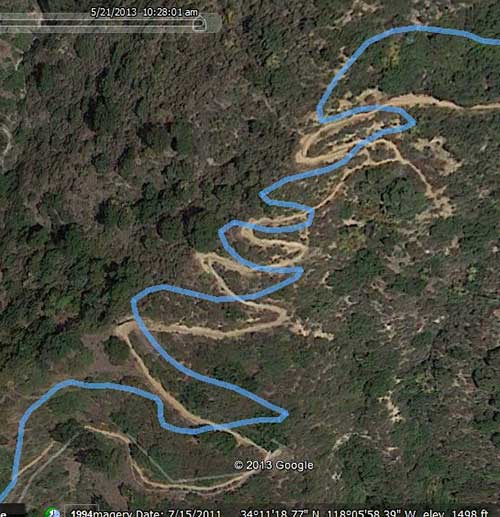
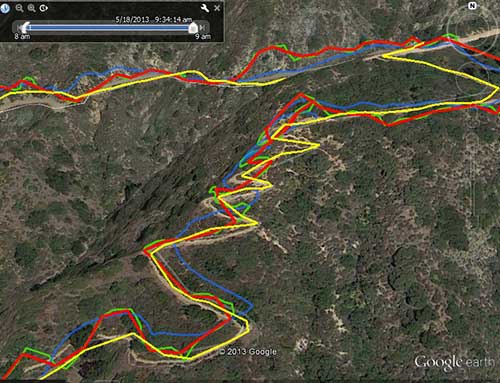
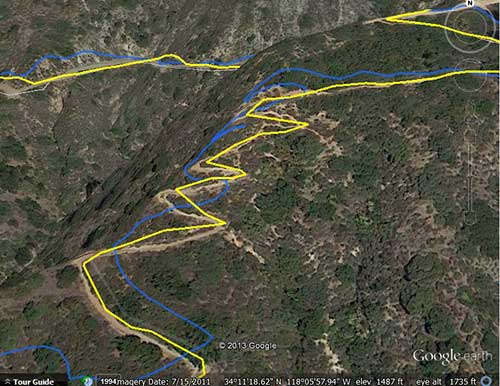
I have tested several other times, and the above trends hold. Furthermore, the Garmin FR10 gives the smoothest, most accurate GPS track, especially when in a canyon, or under heavy tree cover. Below is a canyon track, Garmin FR10 in red, RunKeeper in blue:
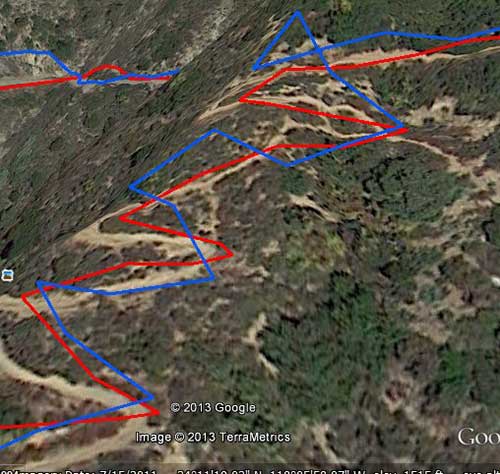
Notice the vastly improved accuracy of the Garmin FR10 track vs RunKeeper running on the iPhone.
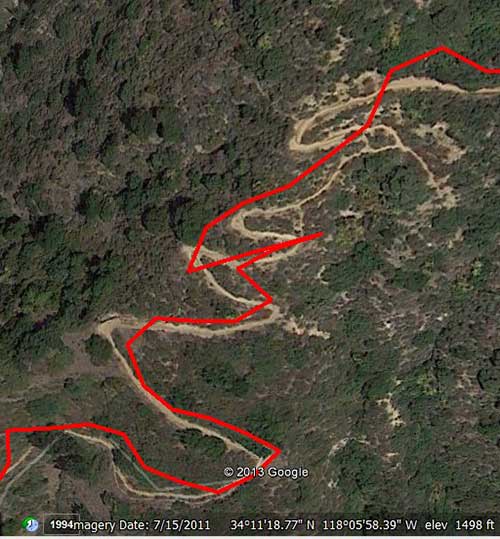
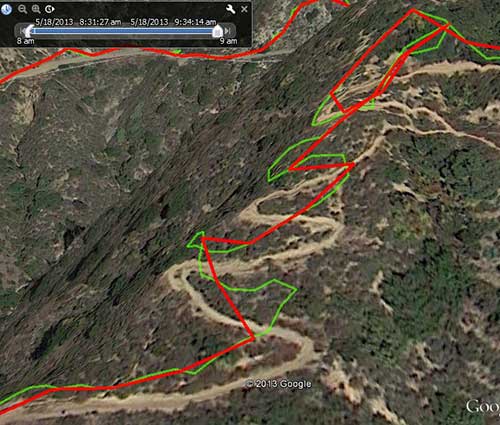
Finally, a canyon track which was recorded on my iPhone 4S, running RunKeeper and MapMyRun simultaneously. RunKeeper is in red, MapMyRun in blue:
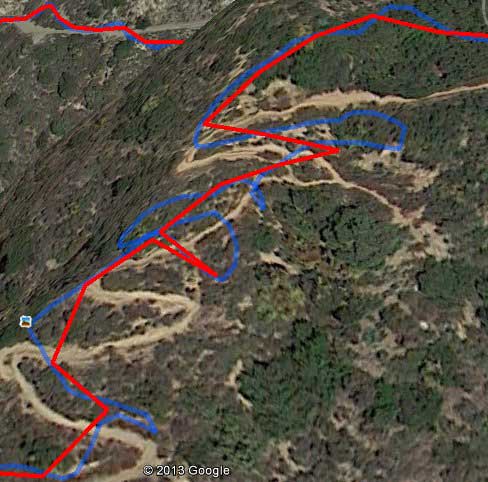
The image above shows the vast differences which sometimes occur between the way that RunKeeper and MapMyRun interpret the same location data stream. Neither track closely follows the actual path. It’s pretty obvious that the Garmin FR10 is a worthwhile upgrade from using the iPhone as a sensor.
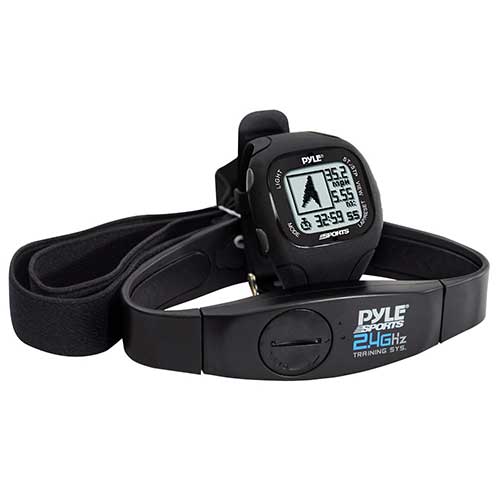
Next Related Post: Garmin Forerunner 10 vs Pyle PSWGP405BK
